Having built multiple financial models for Shasta, I am ‘open sourcing’ a templatized version for SaaS startups replanning in this environment and the advisors helping them.
The tricky part about building a model is finding the right balance between detail for accuracy, simplicity for agility, and flexibility for scalability. This model has worked for me across those criteria, with a couple of notes and caveats:
- as a Series A-focused fund, this model is geared towards companies with early revenue and without distinct sales motions for different customer segments
- the model fits a sales-led business with annual contracts
- the use of this model is for monthly operational & cash planning, not valuation — so not your annual investment banking model. No P&L, balance sheet, cash flow statement, nor DCF-IRR
- this is v1.0, so please send feedback via comments on Excel online or email :)
You can view, download and comment on the model here.

Some of Shasta’s SaaS portfolio
Early-stage planning is about four things: (1) what is the top-line goal, (2) what kind of team do we need to achieve the goal, (3) what expenses do we incur to support the team, and (4) what is our cash outlook. So the model is structured to fit that thinking. Here are the tabs and what they are for.

Model tabs
Inputs: Macro assumptions

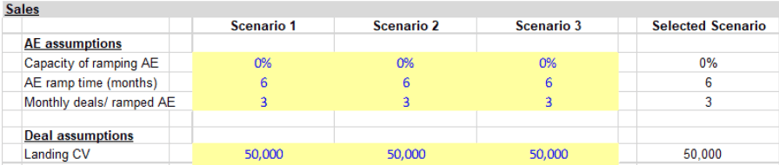
Top rows of the tab showing different sales scenarios
This is where you input most of the non-headcount assumptions and develop different sales scenarios. Top-line scenario planning is important because that is the most difficult to forecast. This is a lengthy tab, but most components are self-explanatory.
Macro: scenario toggle, minimum cash threshold, long term gross margin, and customer lifetime.
- The long-term gross margin and customer lifetime drive the LTV/CAC ratio in the Quarterly Dashboard tab. At the early revenue stage, past data is a rough indicator because gross margins tend to be lower, and the startup is too young to have a good sense of churn.
Sales: account executive productivity, deal terms, sales team ratios, commissions
- This drives the Top Line tab since this shapes the deals that we expect account executives (AEs) to bring. AEs are typically outbound quota-carrying salespeople.
COGS & benefits: fixed and variable COGS, benefits ratio, and bonus month
Salaries: job titles, annual salaries, bonuses, and traveler flag
- The traveler flag is a pre-COVID artifact to flag which positions need a higher monthly traveling budget.
Other expenses: consultants, travel, marketing, facilities, software, corporate, legal, equipment
- As you input your historical numbers, say from Quickbooks, you can get a sense of the average levels to guide your assumptions here.
Financing: new rounds of financing
Inputs: Topline
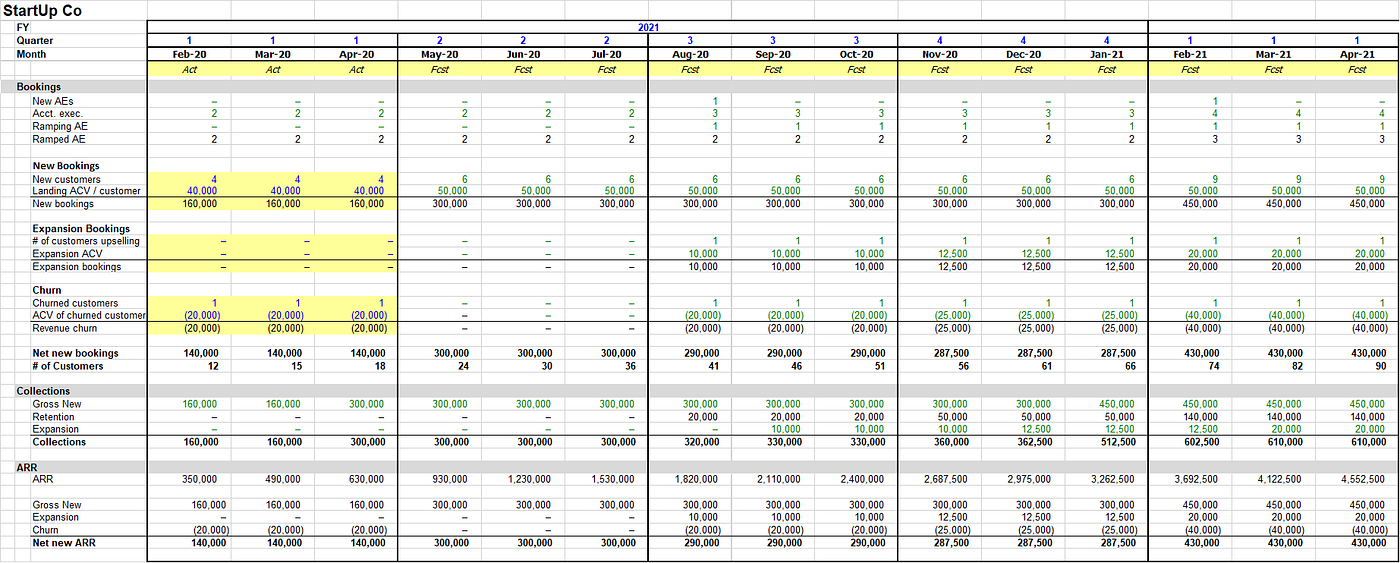
Bookings, collections, and ARR
This is where we see the bookings, cash collections, and ARR. Bookings are driven by AE headcount (Team tab), AE productivity, and deal terms (Macro tab). After bookings come collecting the cash, which is determined by cash collection delay (Macro tab). This is often missed in simpler models but is important to consider because it can move the runway by months.
You only need to input historical/actual figures here.
If you are planning based on ARR targets each year, you have to toggle AE assumptions in the Team and Macro tabs. It will take a bit of getting used to, and that is by design. That exercise forces you to think deeper about each ARR driver.
Inputs: Team

This shows the different departments, positions, wages under each on a monthly basis. You only have to input the headcount for each position and month. That’s it. Some positions like the AE manager, sales engineer (SE), and SE manager are set by a ratio formula on the Macro tab.
Commissions are also calculated here.
Inputs: Expenses

This shows the different expense items based on the assumptions in the Macro tab. You only have to input the historical/actual expenses, outsourcing team headcount, debt payments, and CAPEX.
Inputs: Cash analysis

This shows the cash flows and balances each month. You only have to input historical/actual figures. Pretty straightforward. Cash in. Cash-out.
Output: Key metrics

This shows the monthly ARR, ending cash balance, and runway left. Feel free to add other KPIs here. Maybe some non-financial metrics like employee NPS :)
Output: Quarterly dashboard

This is generally what a growth investor would look at: quarterly SaaS KPIs from ARR growth to magic numbers to LTV/CAC. It will also help you benchmark against other companies and ‘best in class’ metrics.
Final note
There are many ways to extend this model: adding customer segments, allowing monthly contracts, tacking on a marketing funnel, making it product-led, GAAP financial statements, etc. But I will leave that to you. If you’d like a guided version of how to use the model, leave a comment or ping me at kenn[at]shastaventures.com. Hope you find the model useful.
FAQs & Guidelines
- Cell color: yellow means input cells that you should change
- Font color: blue means inputs, black means formulas, and green means it is linked to other tabs
- [XX] are placeholders for job titles and expense items
- Ends fiscal year in January like a lot of SaaS companies but can be adjusted, go to Top Line J4
- To adjust the forecast period, adjust Top Line row 5
- To change scenarios, toggle between 1–3 in Macro D4
- The minimum cash threshold is when the cash balance cells will turn red
Views are my own. Also at kenn.io